Pilots often joke that the drive to the airport is statistically the most dangerous part of any flight. When considering commercial airliners, this statement holds weight. In fact, you’re more likely to be struck by lightning than experience an accident on a commercial airline.[1] This remarkable safety record of commercial aviation often overshadows discussions about other forms of flying. But what about smaller aircraft and private flights?
This leads us to the question: Is general aviation (GA) – encompassing private and personal flights – as safe as driving? While general aviation has made significant strides in safety, achieving historically low accident rates, it still strives to match the impeccable safety standards of commercial airlines.
To truly understand the risks, we’ve conducted in-depth research comparing accident data for general aviation and driving. This comparison is complex, but essential to determine whether it is indeed safer to fly or drive.
In this article, we will delve into a detailed comparison of driving and flying accident statistics, identify the primary causes of general aviation accidents, and explore effective strategies for mitigating these risks.
Key Takeaways
- General Aviation (GA) flights present a higher risk compared to driving. Personal GA flights, in particular, have a fatal accident rate more than 27 times greater than that of driving.
- Pilot error stands out as the predominant cause of GA accidents, contributing to 69% of all incidents. Loss of control in-flight is the most frequent and tragically, the most fatal event.
- Personal flights constitute the majority of GA accidents and fatalities. Conversely, instructional flights exhibit a much stronger safety profile due to their structured nature, supervised operations, and the enhanced proficiency of pilots involved.
- Mechanical failures are the second leading cause of GA accidents, yet they result in fewer fatalities. Issues such as engine failures, while concerning, are often manageable, with approximately half stemming from preventable factors related to pilot actions or maintenance oversights.
Is GA Flying Riskier than Driving?
Directly comparing the safety of driving and general aviation flying is not straightforward. National safety administrations utilize different metrics for reporting accidents in air and road transportation.
For example, the National Highway Traffic Safety Administration (NHTSA) calculates accident rates as “accidents per 100 million vehicle miles traveled.” In 2021, NHTSA reported over 6.1 million crashes and 1.37 fatalities per 100 million vehicle miles.[2]
On the other hand, the National Transportation Safety Board (NTSB) measures aviation accident rates as “accidents per 100,000 flight hours.” In 2021, the NTSB reported 12,368 general aviation crashes and 0.95 fatalities per 100,000 flight hours.[3]
Considering the vast difference in the number of cars versus airplanes, how do these statistics translate to a meaningful risk comparison for general aviation?
A direct comparison between accidents per mile (driving) and accidents per hour (flying) is not statistically sound. Therefore, to effectively answer the question of whether it is safer to fly or drive, we require a unified metric to assess risk.
A 2020 study provides a valuable solution by offering fatal car crash rates per million hours driven. The research indicates a range of 0.6 to 0.7 fatal car crashes per million hours, varying from 1.05 for younger drivers to 0.45 for older, more experienced drivers.[4]
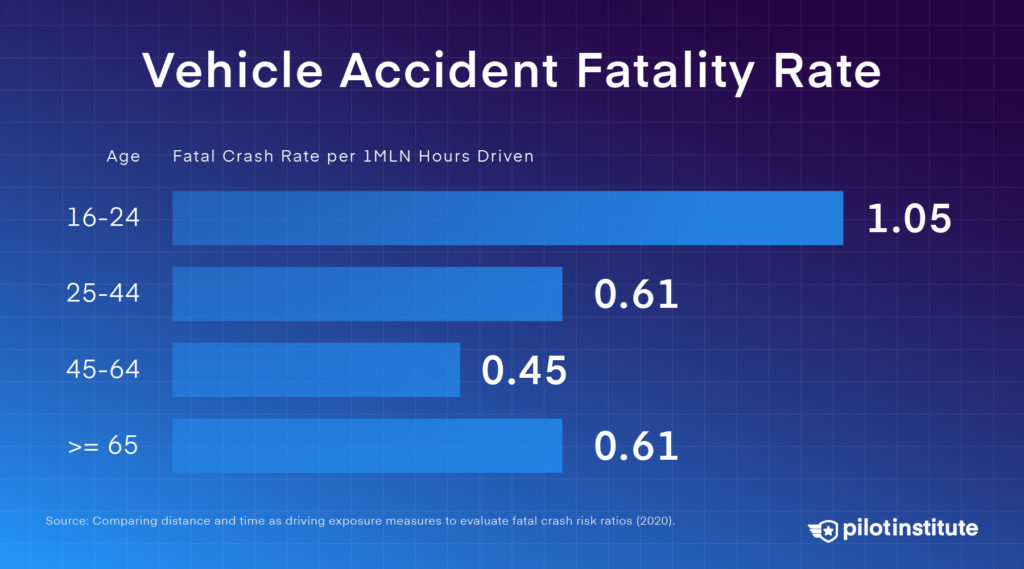 Vehicle accident fatality rate by age.
What about motorcycles? NHTSA data reveals that motorcycle accidents resulting in fatalities occur approximately 27 times more frequently than car accidents when measured per vehicle mile.[5] This translates to roughly 16 to 18 fatal motorcycle accidents per million hours of riding.
So, how does general aviation flying compare to these figures?
Overall GA
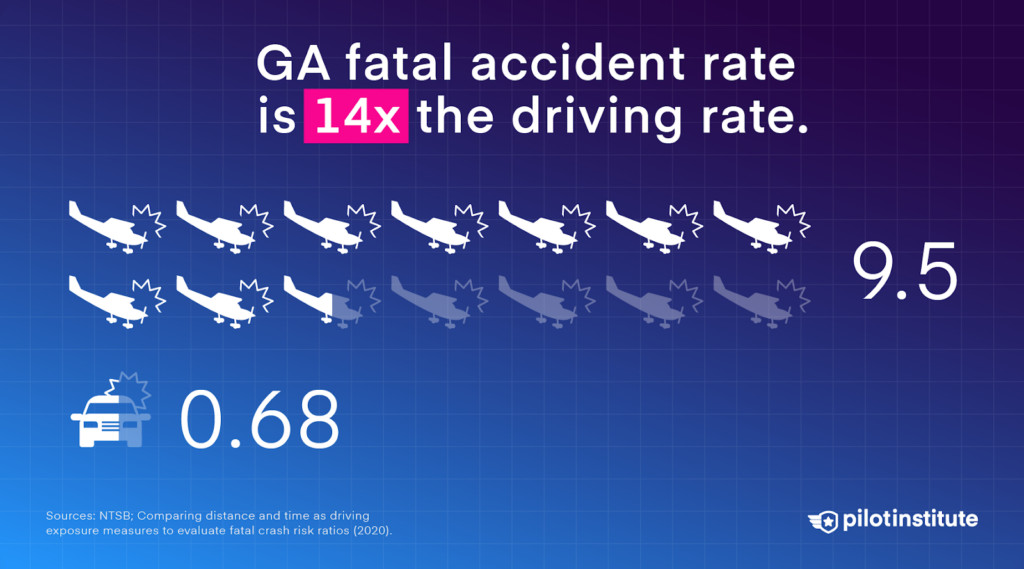 The GA fatal accident rate is roughly 14 times that of driving.
According to the NTSB, there were 0.95 fatal GA accidents per 100,000 flight hours in 2021.[3] By adjusting the decimal place, this equates to 9.5 fatal crashes per million flight hours. This figure is approximately 14 times higher than the driving fatality rate [4] and about half of the motorcycle rate.[5]
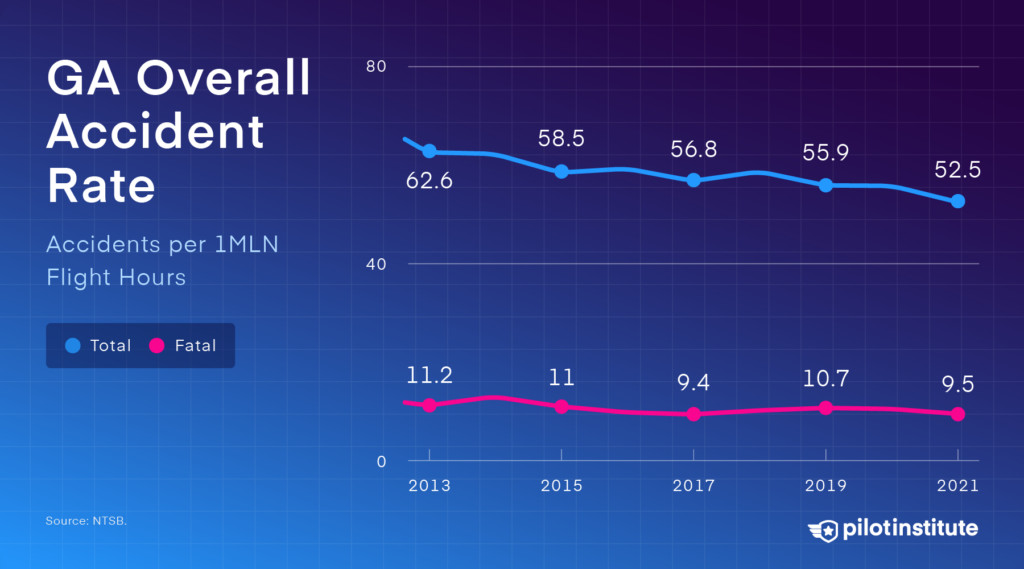 GA overall accident rate: 2012-2021.
Personal Flights
It’s crucial to recognize that general aviation is a broad category, and safety levels vary significantly within its different sectors.
For example, corporate aviation, involving business jets, boasts a relatively strong safety record. This sector experienced only 0.48 fatal accidents per million flight hours between 2012 and 2021.
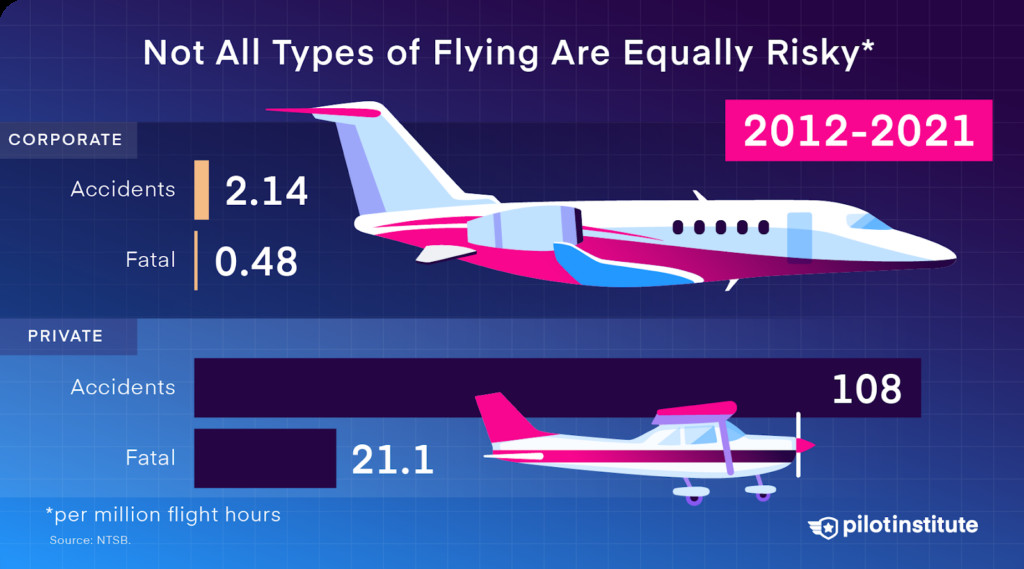 Corporate GA flying is quite safe compared to private flights.
Personal flights, however, represent a disproportionate share of accidents in general aviation, accounting for 67% of all GA accidents and 72% of GA fatalities.[3] These flights include recreational flying and personal transportation.
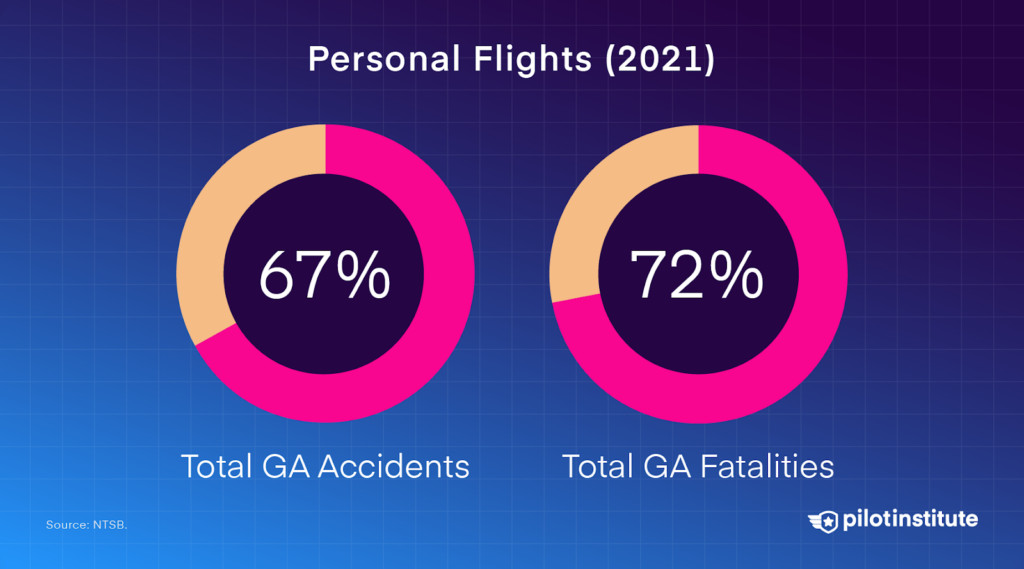 Personal flights account for the majority of total GA accidents and fatalities.
Between 2012 and 2021, personal flights recorded a concerning rate of 21.1 fatal accidents per million flight hours.[3] While fatalities in this category have decreased by 24% since 2012, the rate remains alarmingly high – over 27 times the driving fatality rate. This makes personal flying even more dangerous than riding a motorcycle in terms of fatal accidents per hour.
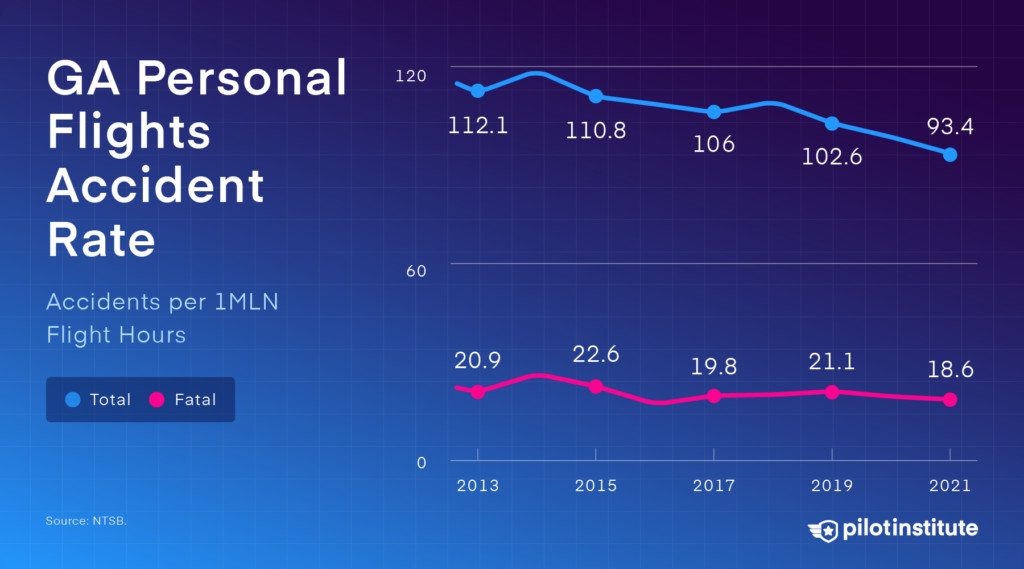 GA personal flights accident rate: 2012-2021.
Instructional Flights
Instructional flights, in stark contrast, demonstrate a significantly better safety record. They experienced 2.3 fatal accidents per million flight hours, a remarkable 52% reduction since 2012.[3] This means that flight training is only about 3.4 times more dangerous than driving, a considerably lower multiple than personal flights.
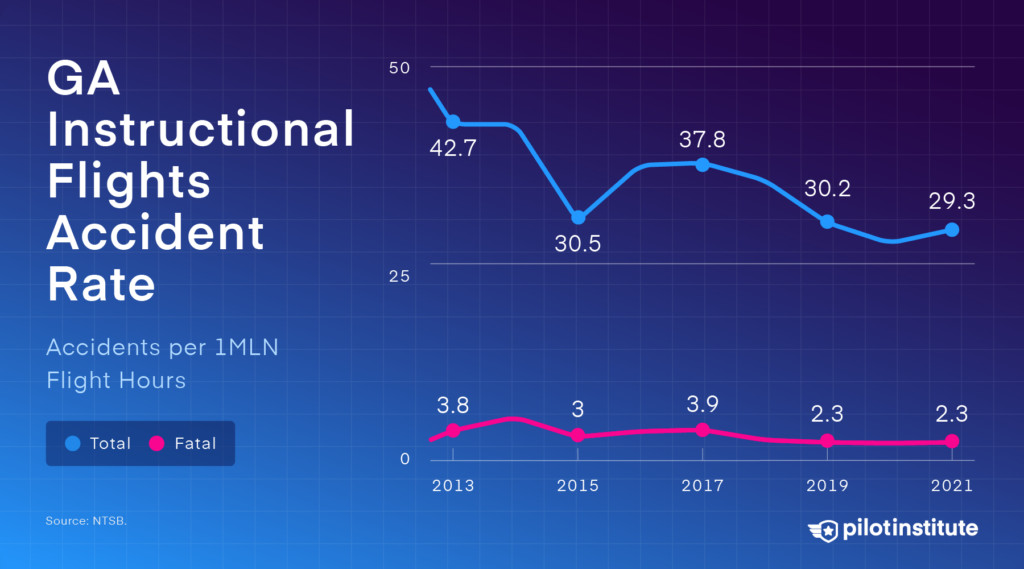 GA instructional flights accident rate: 2012-2021.
Now, let’s examine the factors contributing to the higher accident rates in general aviation, particularly in personal flights, to understand why it is statistically less safe to fly than drive in this context.
Risk Factors in General Aviation
The AOPA’s Richard G. McSpadden Report categorizes the causes of general aviation accidents into three primary groups: Pilot-related, Mechanical, and Other/Unknown.
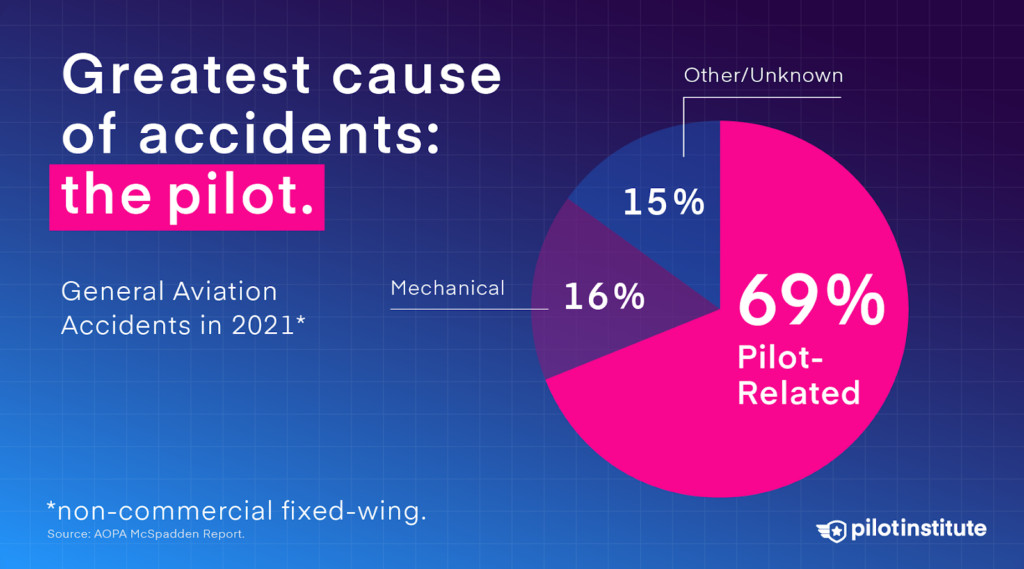 The greatest cause of GA accidents is the pilot.
Other/Unknown Causes
In 2021, a notable 15% of all accidents and a larger 28% of fatal accidents lacked a definitive cause.[6] These “Other/Unknown” accidents present a challenge for safety improvement efforts because the absence of clear causal factors hinders the ability to learn from these incidents and implement targeted preventative measures.
Mechanical Causes
Mechanical issues involving the aircraft itself constitute the second most common category of accidents in general aviation. In 2021, mechanical failures accounted for approximately 16% of all accidents but a smaller 7% of fatal accidents.[6]
“Mechanical accident” is a broad classification, encompassing various system and component failures. Let’s break down the types of mechanical issues encountered in GA accidents.
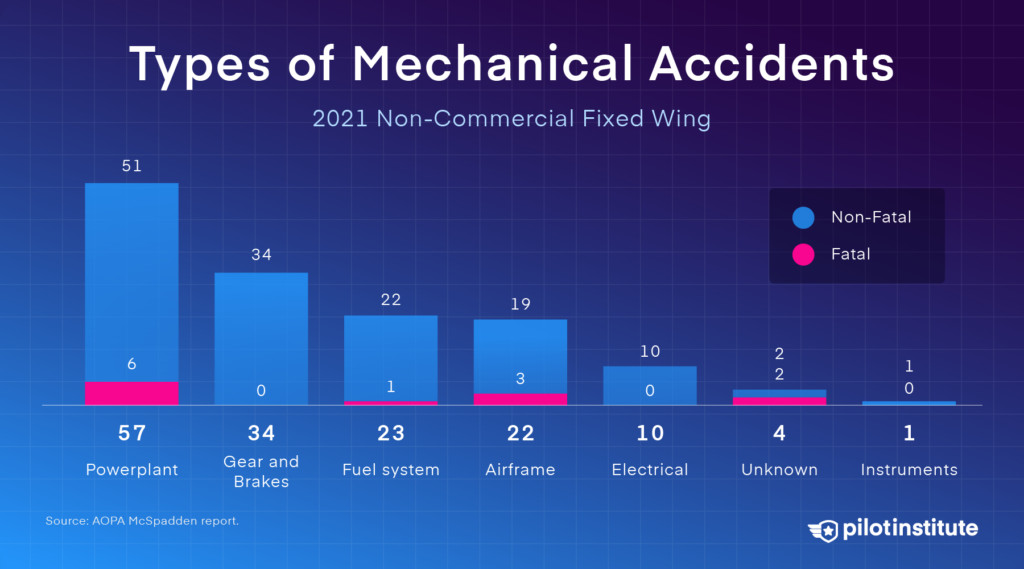 Types of GA mechanical accidents.
As anticipated, engine-related problems are the most significant contributor to mechanical issues in GA accidents.
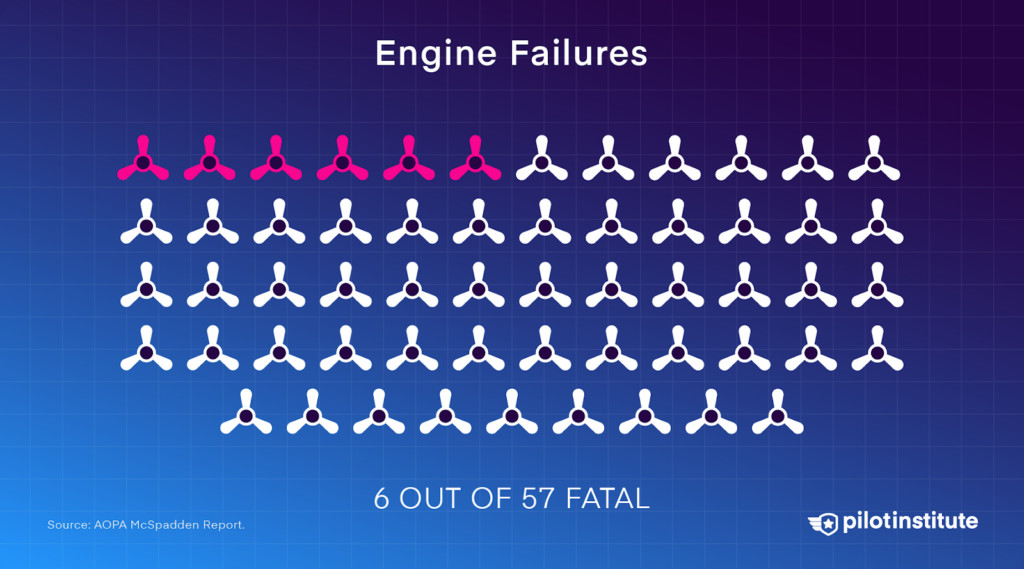 Six out of 57 engine failure accidents in 2021 were fatal.
However, a noteworthy finding is that despite the inherent fear associated with engine failures in flight, they are often manageable emergencies. In 2021, out of 57 reported engine failures, only six resulted in fatalities.[6]
AOPA’s analysis revealed that 30% of engine failures lack a clear identifiable cause. Maintenance-related issues are implicated in 16% of engine failures, and structural failures account for 17%.[6] The remaining portion of engine failures is attributed to preventable problems, such as carburetor icing or fuel mismanagement.
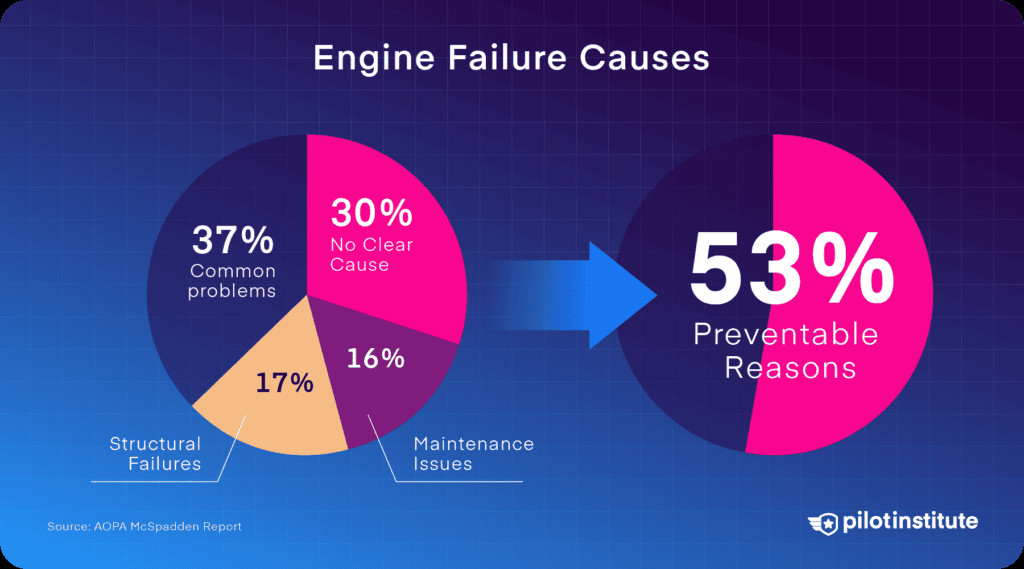 A diagram depicting the reasons for engine failures.
In essence, pilot actions or maintenance oversights contribute to approximately half of all engine failures in general aviation. This highlights a critical area for improvement through enhanced training and rigorous maintenance practices.
Another significant mechanical-related cause is fuel system issues. Fuel-related accidents in GA typically fall into three main categories.
First, fuel contamination, often by water, occurs when substances other than fuel are present in the fuel tank. This is why pre-flight fuel checks are a mandatory procedure before every flight.
Second, fuel starvation can occur even with sufficient fuel on board if it fails to reach the engine. Common causes include incorrect fuel tank selection or inadvertently leaving the fuel selector in the OFF position – a surprisingly easy and dangerous mistake.
Lastly, fuel exhaustion, simply running out of fuel, is frequently a consequence of inadequate flight planning and fuel management.
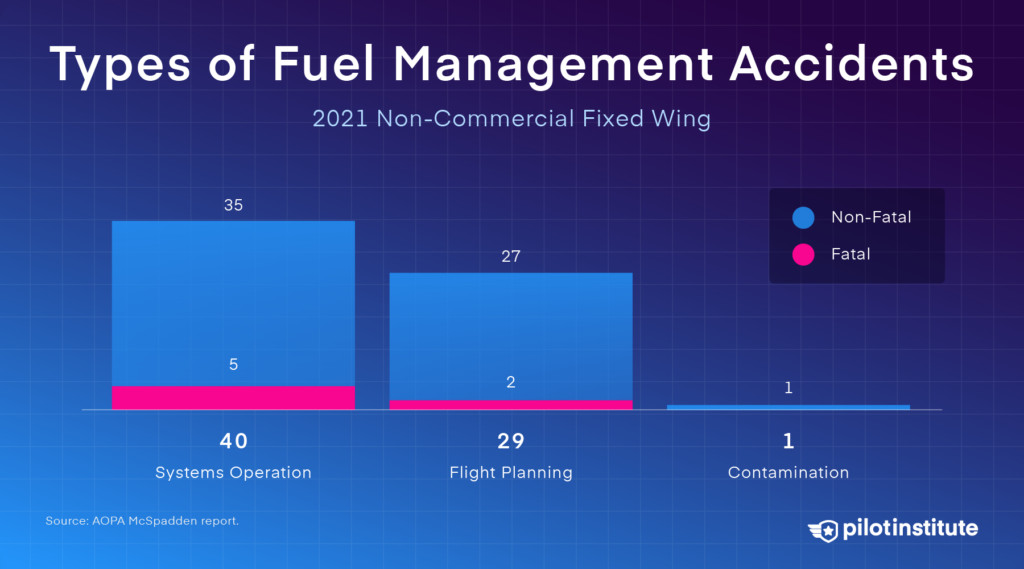 Types of GA fuel management accidents.
Now, let’s delve into the most dominant factor in general aviation accidents: pilot-related causes.
Pilot-related Causes
Since the inception of aviation, continuous efforts have been made to enhance aircraft safety and mitigate risks. Despite advancements in aircraft technology and pilot training, human factors remain the leading cause of accidents in general aviation.[6]
While the trend of pilot-related accidents has shown a downward trajectory over the long term, it has plateaued in recent years. In 2021, accident investigators determined that pilot error was a factor in 69% of all GA accidents (647 out of 938). This figure underscores the critical role of pilot decision-making and skill in aviation safety.[6]
The NTSB provides a more granular view of pilot-related accident causes, categorized as “defining events.”
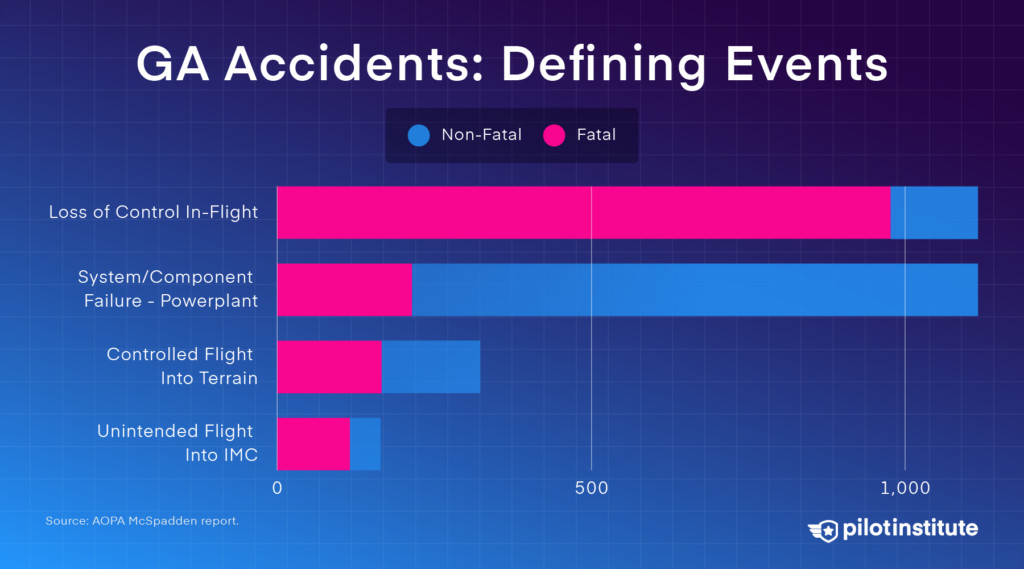 A selection of GA accident defining events.
Analyzing the top causes, the NTSB identifies loss of control in-flight (LOC-I) as the most prevalent cause of accidents and, tragically, the most fatal defining event.[3]
Loss of Control In-Flight
 Loss of Control In-Flight: the leading cause of fatal accidents.
Loss of control in-flight (LOC-I) typically signifies that the pilot lost the ability to maintain the aircraft’s intended flight path and attitude. This can stem from various factors, including flying too slow, making uncoordinated control inputs, or experiencing unexpected turbulence. A significant portion of LOC-I accidents, approximately half, involve stalls and spins occurring in the traffic pattern during maneuvering flight, particularly during landing approaches. These situations are often unrecoverable due to the low altitude and critical phase of flight.
 Major types of GA accidents.
Landings
Landing accidents are frequent occurrences in general aviation, but they are generally less likely to result in fatalities compared to other accident types. The most common type of landing accident is loss of control during the landing phase.
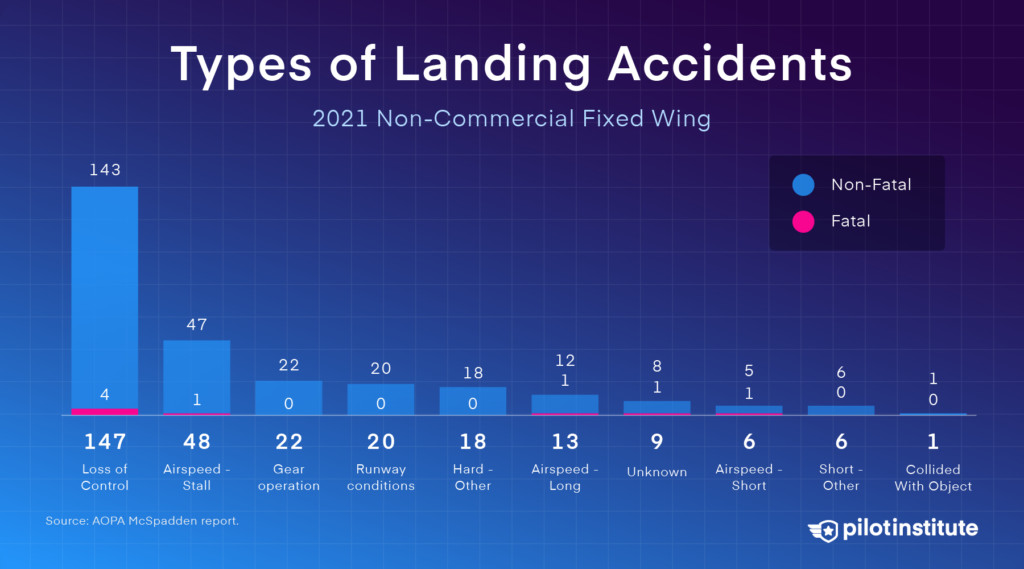 Types of GA landing accidents.
Takeoff and Climb
Accidents during takeoff and climb phases of flight tend to have a higher fatality rate compared to landing accidents. This is primarily because the aircraft is in a low-energy state at low altitude with a high angle of attack immediately after takeoff, leaving minimal margin for error in the event of an emergency.
Alt text: Bar graph breaking down the types of takeoff and climb accidents in GA, including engine failures, stalls, and loss of control, highlighting the critical nature of these early flight phases.
While stalls during landing are often survivable, stalls during takeoff and climb are considerably more dangerous and are the deadliest cause of accidents in these phases of flight. In 2021, thirteen out of 30 reported stall-related takeoff accidents were fatal.[6]
Many of these takeoff and climb accidents are likely associated with attempts to perform the “impossible turn” – a risky maneuver where pilots attempt to turn back to the runway after an engine failure shortly after takeoff.
Controlled Flight into Terrain
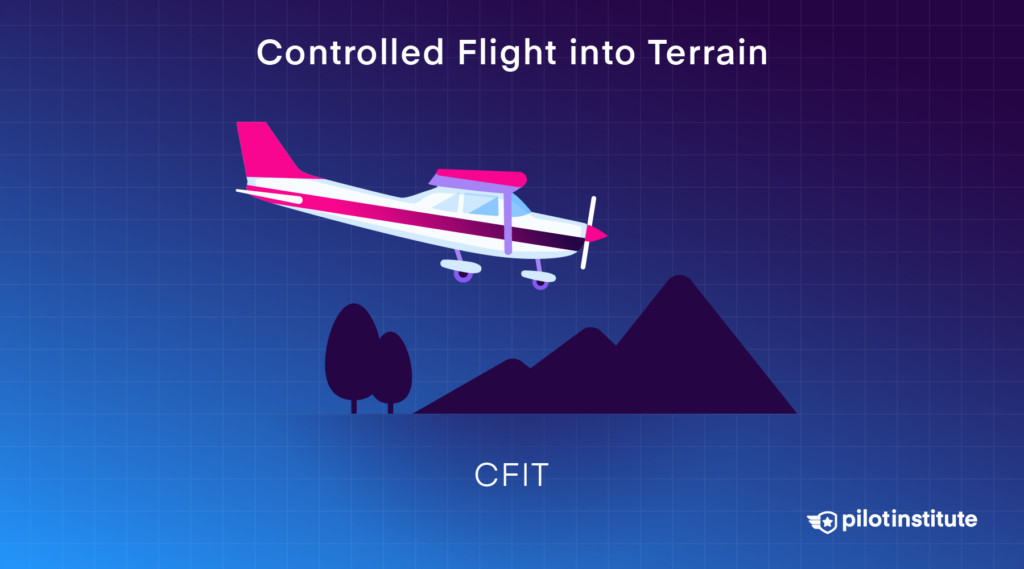 Controlled Flight into Terrain: a top cause of fatal accidents.
Controlled Flight Into Terrain (CFIT) is another leading cause of fatal accidents in general aviation. CFIT occurs when an aircraft, under the pilot’s control, is unintentionally flown into terrain or obstacles. This often results from a complete loss of situational awareness, particularly in challenging weather conditions or during night flights, or when pilots attempt to descend below safe altitudes during instrument approaches.
Unintended VFR Flight into IMC
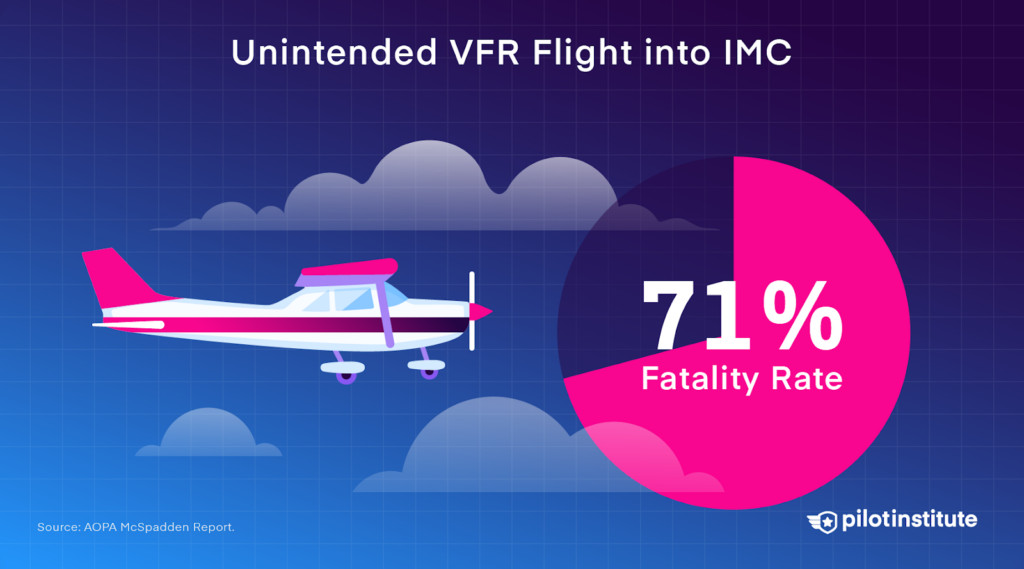 Unintended VFR flight into IMC has a 71% fatality rate.
Another preventable cause of fatal accidents is unintended VFR (Visual Flight Rules) flight into Instrument Meteorological Conditions (IMC). Accidents resulting from pilots flying visually into clouds or conditions of low visibility had a staggering 71% fatality rate in 2021.[6]
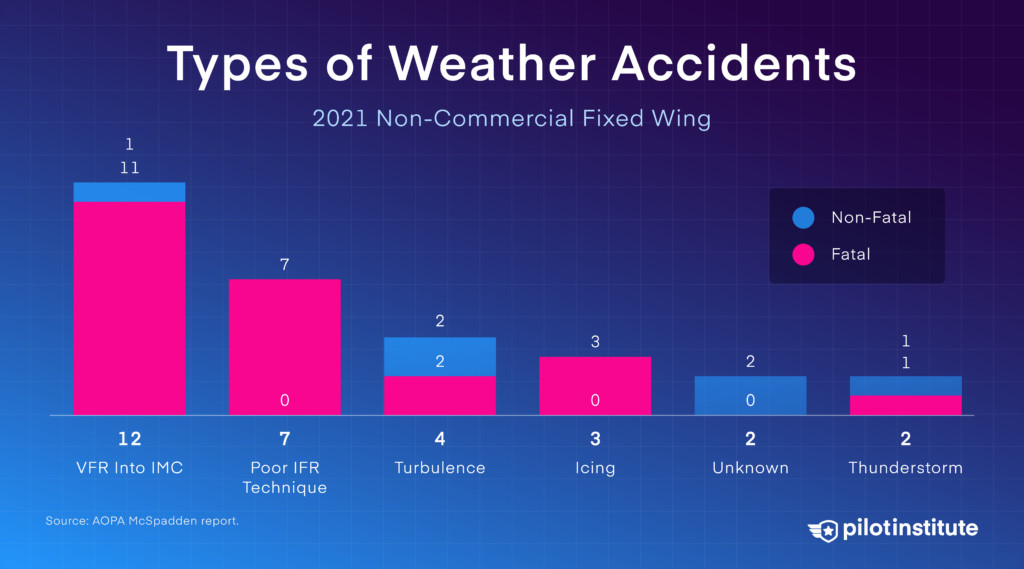 Types of GA weather accidents.
Poor instrument flying skills and airframe icing also contributed to fatal weather-related accidents in 2021.[6] Operating in IMC demands a high level of pilot proficiency and aircraft capability. Often, the safest decision is to cancel or postpone a flight when encountering or anticipating IMC, especially considering that most general aviation aircraft are not equipped for sustained flight in icing conditions or thunderstorms.
So, what valuable lessons can we derive from these sobering statistics when considering if it is safer to fly or drive in general aviation?
While general aviation flying, particularly personal flights, may never achieve the statistical safety levels of driving, there are significant steps pilots can take to substantially reduce risk and still enjoy the unique privileges of flight.
The key for pilots lies in prioritizing not just currency – meeting the legal minimums for flight – but true proficiency. Proficiency entails consistently going above and beyond legal requirements to maintain and enhance flying skills.
However, the pursuit of safety in general aviation extends beyond individual pilot actions.
Safety Measures and Best Practices
 FAA Risk Assessment Matrix.
Let’s revisit instructional flights and their comparatively lower fatality rate, approximately one-eighth that of personal flights. What factors contribute to this enhanced safety profile in flight training environments?
Firstly, instructional flights operate within a highly supervised environment. Flight instructors provide real-time guidance and oversight, mitigating potential errors.
Secondly, flight schools adhere to highly structured operational procedures and safety protocols. Risk-taking behavior is actively discouraged and managed within the training framework. Risk-taking is systematically addressed through training and standardization.
Thirdly, flight schools typically maintain their training aircraft to stringent standards. Unlike privately owned personal aircraft, instructional airplanes are often subject to more frequent and rigorous maintenance schedules, including mandatory 100-hour inspections.
Finally, flight instructors, by the nature of their profession, tend to maintain a higher level of proficiency compared to private pilots who may fly less frequently. Instructors are continuously engaged in flying and teaching, reinforcing their skills and knowledge.
These factors mirror the reasons behind the exceptional safety record of airline travel. Commercial airlines operate with highly structured and risk-averse systems. Their pilots undergo extensive training, maintain rigorous proficiency standards, and operate within a robust safety culture.
The encouraging news for general aviation pilots is that these principles and best practices are not exclusive to airlines or flight schools. GA pilots can proactively adopt a safety-focused mindset and implement similar measures in their flying activities.
Conclusion
As aviators, whether flying for personal enjoyment or transportation, maintaining unwavering discipline and making sound judgments are paramount, even when flying solo. Even seemingly minor lapses in judgment can quickly compound and escalate into significant problems in aviation.
Analyzing accident case studies provides invaluable insights into how seemingly small errors can rapidly cascade into critical situations. To illustrate this point, consider watching this video, which vividly demonstrates the speed at which events can unfold and go wrong in aviation.
Ultimately, while personal general aviation carries a statistically higher risk than driving, a commitment to continuous learning, rigorous self-assessment, adherence to best practices, and a proactive safety mindset are crucial steps in mitigating these risks and enjoying safer skies.
Data Sources
[1] National Safety Council – Odds of Dying
[2] National Highway Traffic Safety Administration (NHTSA) – National Statistics
[3] National Transportation Safety Board (NTSB) – General Aviation Dashboard
[4] National Center for Biotechnology Information (NCBI) – 2020 study on car crash rates
[5] National Highway Traffic Safety Administration (NHTSA) – Motorcycle Safety
[6] AOPA – Richard G. McSpadden Report